3.2 Performance
3.2.1 My Performance
3.2.2 My Status
3.2.3 My Interactions
3.2.4 My Queues Activity
3.2.5 Exporting, Scheduling, and Expiring Reports
(Video instructions available: Performance)
Use the Performance Workspace to view personal statistics, statistics of assigned queues, and interactions. Select the help button in the bottom left corner of the window for help text specific to this view.
Click Performance, and then click Workspace.
.png)
From the Performance>Workspace>New Tab screen, scroll down to the section titled My Performance and select My Performance.
.png)
From the My Performance tab you can toggle between Performance, Statuses, and Interactions.
| Note | The Evaluations, Schedule, Scorecard, and Development tabs are not used. |
.png)
Click the plus button to the right of the My Performance tab to open a new tab or multiple tabs. Scroll down and click the desired hyperlinks in the left pane to view specific performance information.
.png)
You can perform this step multiple times until all desired tabs are displayed. Recommended views include: My Interactions, My Performance, My Queues Activity, and My Status.
.png)
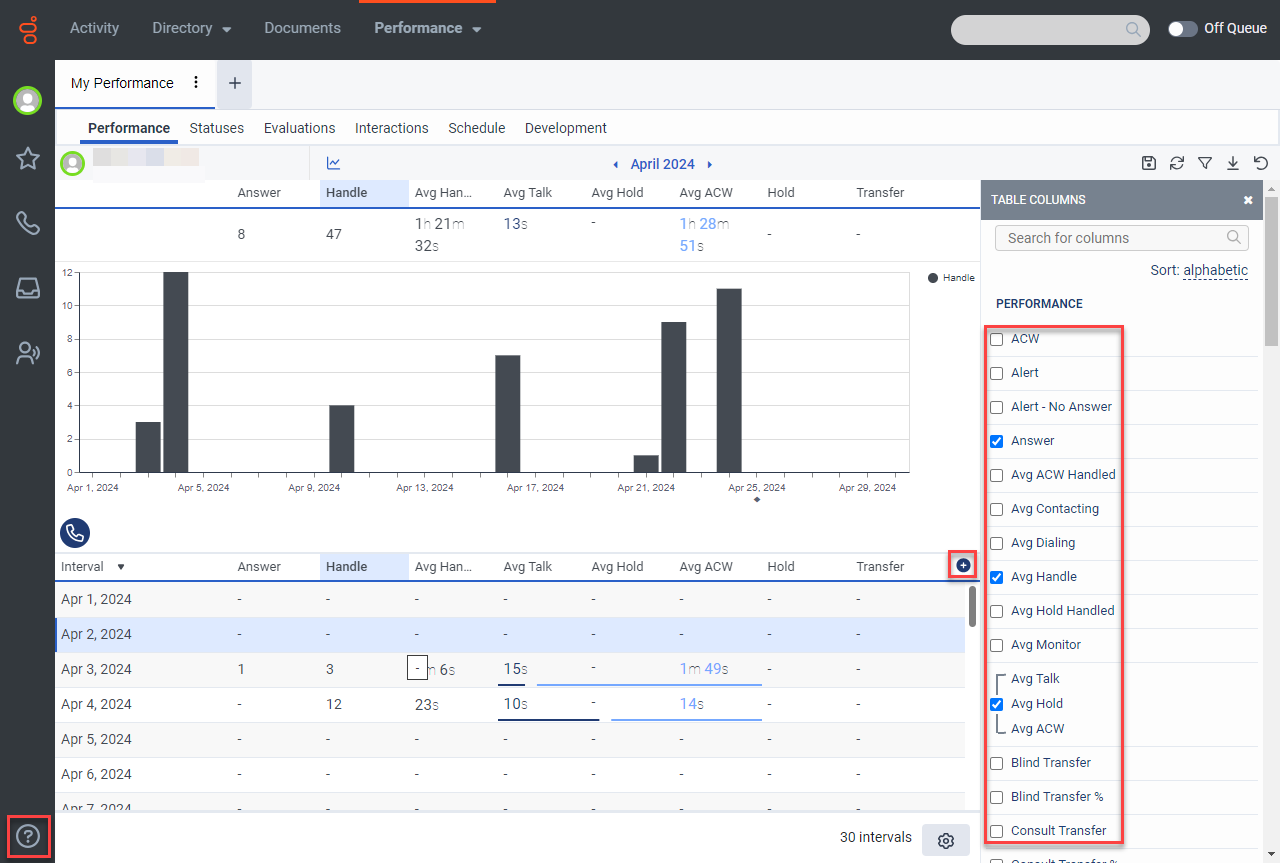
On the My Performance (or Performance) and My Status (or Statuses) pages, the top row displays the summary row for each metric’s average over the selected time period. If you select one of the summary metrics (Answer, Handle, Avg Handle, Avg Talk, Avg Hold, Avg ACW, Hold or Transfer) a chart displays, and a table below that displays daily details in half hour intervals.
.png)
| Note | Internal calls (Genesys user to Genesys user) may not be displayed in the Performance view. |
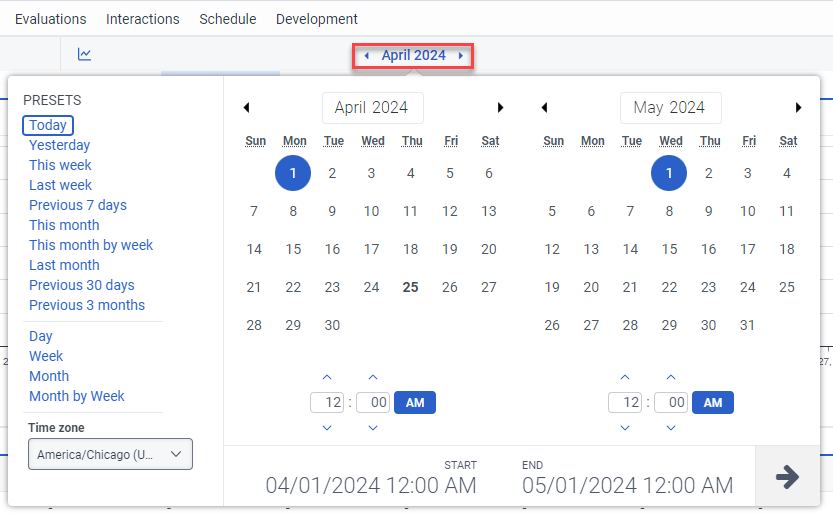
Change the time period by clicking the date filter (blue date at the top center of the tab) and selecting a time preset or entering a specific range.
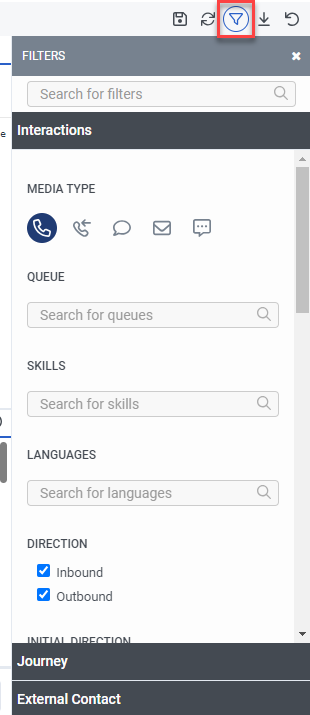
Click the filter button on the top right side of the tab to choose one or more filters for the displayed metrics.
For details about the information displayed in each column, click the help button in the bottom of the communications sidebar and scroll down to Available Columns. Note that the term Automatic Call Distribution (ACD) is used in the help files. ACD refers to inbound calls in the queue.
To add additional metrics, click the plus button on the far right of the workspace and select columns from the list.
Click the save button to save your desired view.
.png)
This page last updated in Release Number: 25-01
Release Date:04/09/2025
Effective Date: 04/09/2025